Xinya Classroom | Research on Partial Discharge Under DC Voltage
Xinya Classroom: Research on partial discharge under DC voltage. I. Introduction to DC partial discharge. The use of partial-discharge methods to assess the insulation condition of AC high-voltage equipment has attracted widespread attention and made significant progress, with some findings already applied in engineering.
I. Introduction to DC Partial Discharge
The use of partial-discharge methods to assess the insulation condition of AC high-voltage equipment has attracted widespread attention and made significant progress, with some findings already applied in engineering. Partial-discharge measurement under AC conditions has become an effective method for evaluating the insulation condition of dielectrics. However, measurement and analysis of partial discharge under DC conditions are not as mature as under AC conditions.
In terms of the underlying mechanism, under DC conditions, neither the magnitude nor the polarity of the voltage changes. Once a discharge occurs in an internal void, space charge establishes a reverse internal electric field in the void. After the discharge extinguishes, a second discharge does not occur until the space charge is neutralized through the internal conductivity of the dielectric and the reverse field has weakened to a certain level. Thus, under DC voltage there is no repetitive discharge cycle, and the number of discharges per unit time is much lower than under AC voltage.
With the widespread application of high-voltage DC equipment, many devices now operate under DC conditions, so partial discharge in their insulation cannot be ignored. Assessment of DC partial-discharge signals is based primarily on statistical analysis of basic parameters, including discharge magnitude, number of discharges, time-parameter curves, the test voltage at which the first discharge exceeding the specified magnitude occurs, the number of discharges within a specified time at a specified DC voltage, and the number of discharges during the self-discharge period.
II. Analysis of DC Partial-Discharge Characteristics
1. No periodicity
For AC partial discharge, statistical parameters for multiple discharge pulses—including discharge magnitude Q, phase Ф, and discharge count N—are processed to produce various curves and spectra. These are used to study partial-discharge signals from different locations or of different types in electrical equipment. Because DC partial discharge has no repetitive cycle, it has no phase Ф as used in AC statistical parameters; its characteristic quantities therefore need to be determined anew.
2. Random discharge timing
Under DC conditions, the time at which a test object discharges is random, and the number of discharges per unit time is much lower than under AC voltage. Different discharge types have characteristic intervals between successive discharges, which can be used for defect analysis.
3. High inception-discharge voltage
Under DC partial-discharge conditions, the electric-field distribution in the insulation is proportional to the resistivity of the dielectric. The resistivity of a typical insulating dielectric is greater than that of an inclusion. Therefore, under DC conditions, the dielectric’s breakdown field strength is generally greater than that of the inclusion, so the inception-discharge voltage for DC partial discharge is higher than under AC voltage.
4. Fewer discharges
Under DC voltage, when the voltage across an internal void in the insulation exceeds the void’s breakdown voltage, partial discharge occurs in the void. The resulting positive and negative ions attach to the void wall and create an electric field opposite to the applied field, preventing further partial discharge in the void. Only after a considerable time, when these charges leak away through the surface conductance of the void and the volume conductance of the dielectric, can another partial discharge begin. Thus, the number of discharges is also much lower than under AC voltage.
III. Statistical Analysis of DC Partial-Discharge Data
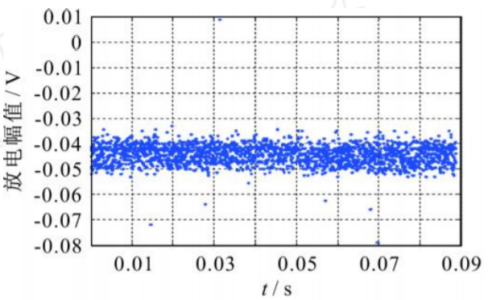
- Q-t analysis plot
The Q-t analysis plot displays each discharge event over time. Because the test lasts a long time, it can display only the waveform within a certain time window (or sampled data).
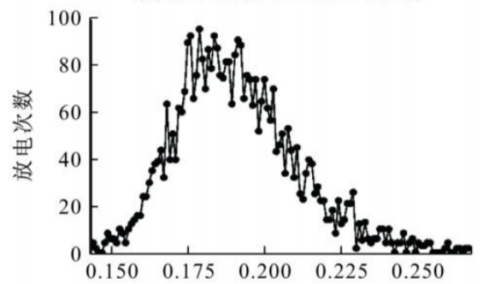
- Qn-Δt analysis plot
The Qn-Δt analysis plot shows the relationship between the discharge interval and the number of discharges.
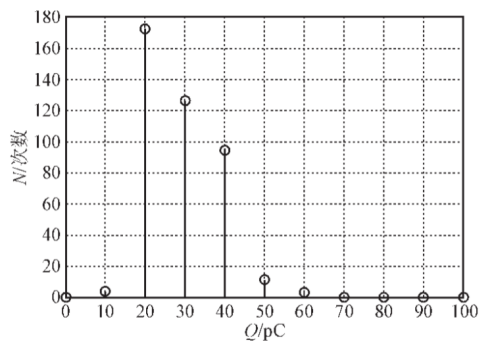
- Qn-Q analysis plot
The Qn-Q analysis plot shows the relationship between discharge magnitude and the number of discharges.
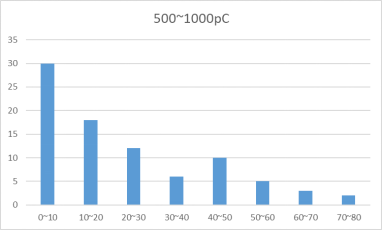
4. Qn-t analysis plot
The Qn-t statistical plot primarily shows the number of discharges within a given time window.
Jiangsu Xinya High Voltage Test Equipment Co., Ltd. Address: No. 58 Gaoshu North Road, Hanjiang District, Yangzhou Tel: 0514-87346289 Fax: 0514-87310758 E-mail: yzxy@yzxinya.cn Website: www.yzxinya.cn